Debug Windows include Console Output, Watch, Call Stack, Variables, Threads, Memory, Registers, Disassembly and Breakpoints winidow.
They provide more details for debug infomation.
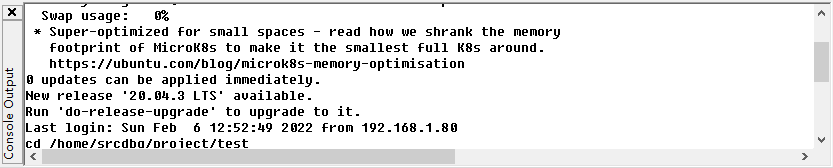
Console Output: Show the application Console Output window.
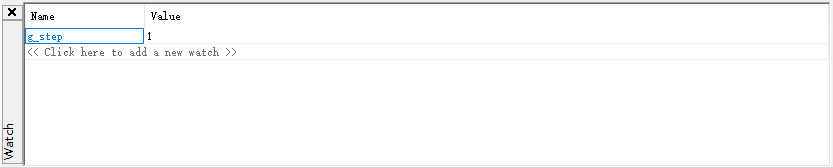
Watch: The Watch window can be used to view and modify debug watches.
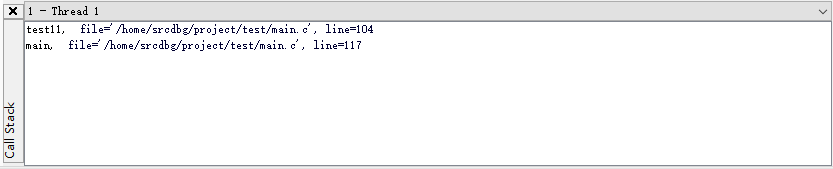
Call Stack: The Call Stack window displays the Call Stack.
Whenever the debug program is paused at a breakpoint or during manual stepping, the current stack is displayed as a docked window.
This list shows all stack frames encountered between invocation of the program and the current run position.
Outermost stack frames are higher up on the list.
When the debugger steps or stops at a breakpoint or exception, it selects the innermost stack frame by default.
In order to visit other stack frames further up or down the stack double-click directly on the surface of the stack in the top panel of the debugger window.
When you change stack frames, the variables views will be changed accordingly, and the current line of code at that stack frame is presented in an editor window.
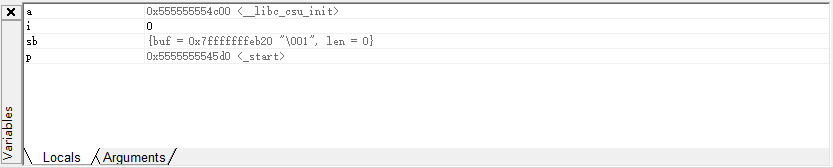
Variables: The variables window displays the locale variables and call parameters.
You can view both visible variables and local parameters in the project, by selecting the appropriate tab in the tab control.
You can change the values of most variables while debugging. Simply click on the value to enter "edit" mode. Complex variables are displayed with grey text and cannot be modified.
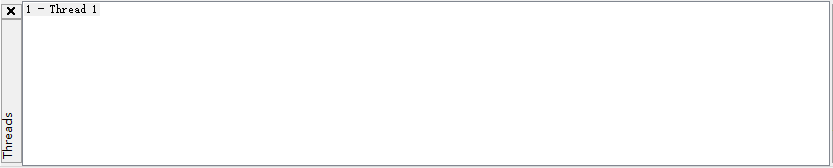
Threads: The Thread window displays the running threads
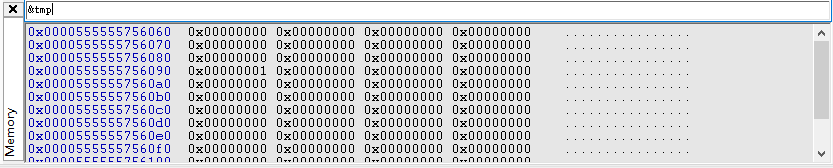
Memory: The Memory window can be used to inspect the memory area of the running application.
You can enter a direct memory address, or an expession that evaluates to a memory address in the Address field to inspect the memory area. This could be the address reference of a variable in you code.
The expression must be valid and access data that is currently in scope in the debug session.
You can enter any type of expression that evaluate to a memory address. Even complex expressions are supported (using arithmetics).
To modify the memory values, double-click on a value to enter "edit" mode.
You can change the display type of the values from hexadecimal to octal or decimal display, by appending a format identifier.
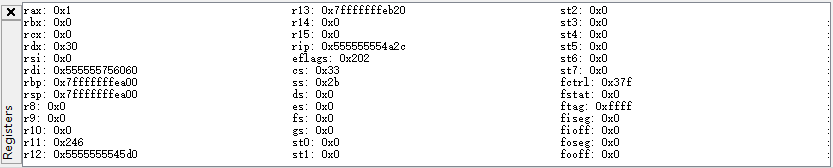
Registers: The Register window displays the values of all CPU registers.
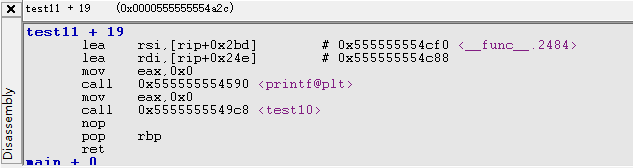
Disassembly: This window displays the Disassembly code of current PC.
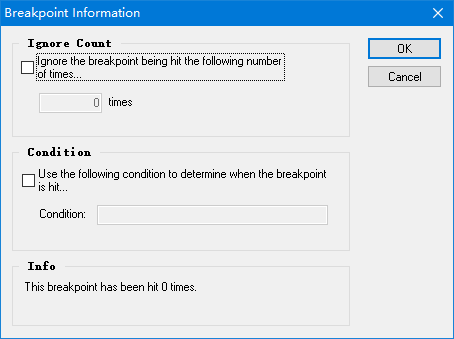
Breakpoints: This window displays the active breakpoints.
You can enable, disable or delete a breakpoint.
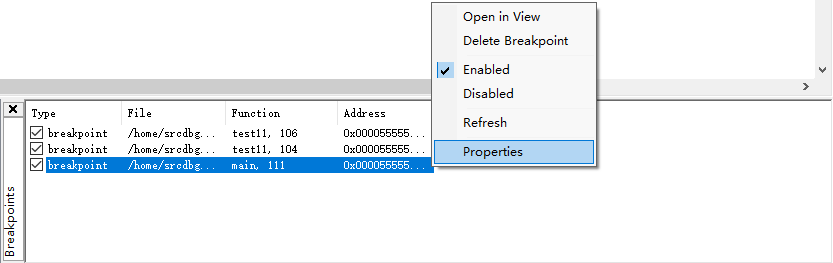
You can also set it as a condition breakpoint. Configure its properties via the right-click menu.