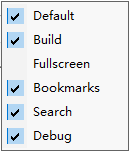
The main toolbar appears at the top of the Source Debug program window. You can toggle the whole main toolbar on and off with the right click the toolbar and choose the items.
The main toolbar is made up of smaller sub toolbars. The position of each toolbar is saved in the configuration file automatically.
Toolbar context

Toolbar

| Icon | Shortcut | Description |
|---|---|---|
| F11 | Go Back | |
| Ctrl+F11 | Go Forward | |
| F12 | Jump to definition, declaration or open the including file at cursor | |
 |
Create a new solution | |
 |
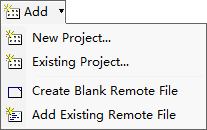
Add a new project to the solution Add an existing project to the solution Create a blank remote file and add it to the project Add an existing remote file to the project |
|
| Ctrl+N | Create a new local file | |
| Ctrl+O | Open a local file | |
| Ctrl+S | Save current document | |
| Save all documents | ||
| Ctrl+X | Cut | |
| Ctrl+C | Copy | |
| Ctrl+V | Paste | |
| Ctrl+Z | Undo | |
| Ctrl+Y | Redo | |
| View whitespace and tab | ||
| Word Wrap | ||
| Ctrl+F7 | Compile | |
| Shift+F7 | Build current project | |
| Rebuild current project | ||
| Stop building | ||
| Select Release or Debug mode to build the project. | ||
| Ctrl+F12 | Toggle fullscreen or normal mode | |
| Ctrl+1 | Navigate to First Location of Bookmarks | |
| Ctrl+2 or Ctrl+F2 | Navigate to Previous Location of Bookmarks | |
| Ctrl+3 | Navigate to Current Location of Bookmarks | |
| Ctrl+4 or F2 | Navigate to Next Location of Bookmarks | |
| Ctrl+5 | Navigate to Last Location of Bookmarks | |
| Ctrl+6 | Define current line as Starting Location | |
| Ctrl+7 | Mark Current Line as a Bookmark Location | |
| Ctrl+8 | Clear Location Mark in the document | |
| Ctrl+9 | Open the Location File | |
| Ctrl+D | Find box to find text directly. If it is a num and following a Ctrl + G will go to that line. | |
| F5 | Start / continue the debugger | |
| Pause the debugger | ||
| Shift+F5 | Stop the debugger | |
| Restart the debugger | ||
| Shift+F7 | Set the line of code that the debugger will run next | |
| Ctrl+F7 | Show the line of code currently running in the debugger | |
| F9 | Step into the next statement | |
| F10 | Step over of the current method | |
| F8 | Step out of the current method | |
| Alt+F6 | Execute the application until the instruction at the cursor is reached | |
| Toggle the display mode(Hex or Decimal) of the debugger to show the value of variables | ||
| Quick watch selected symbol in current document | ||
| Show or hide the Watch window. Use this window to view and modify debug watches | ||
| Show or hide the Call Stack | ||
| Show or hide the variables. This window displays the locale variables and call parameters | ||
| Show or hide the Memory window | ||
| Show or hide the Breakpoint window. This window displays the active breakpoints | ||
| Show or hide the application Console Output window | ||
| Show or hide the Disassembly window. It displays the Disassembly code of current PC | ||
| F6 | Jump to the source location of the symbol in the debug symbol table. | |
| F7 | Jump to the next source location of the symbol in the debug symbol table. |